

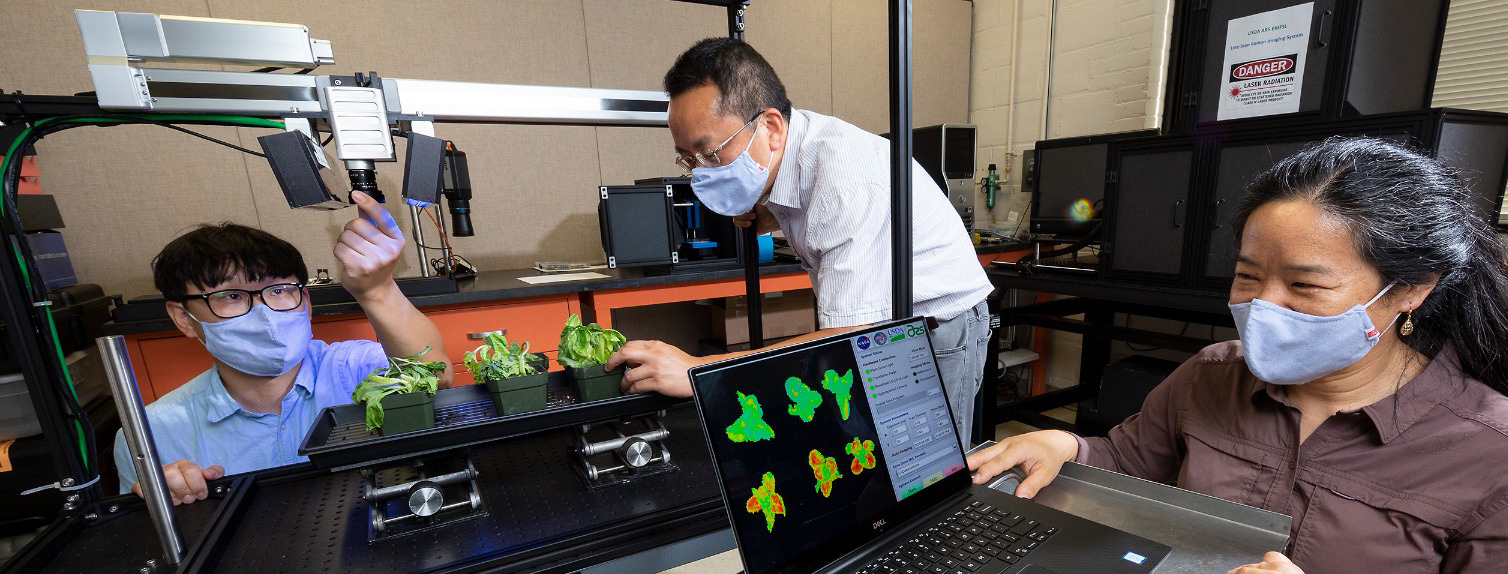
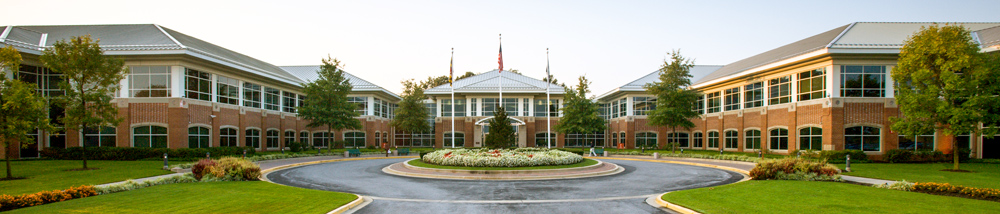
On July 24, 2025, the U.S. Department of Agriculture (USDA) announced that it would vacate the Beltsville Agricultural Research Center (BARC). BARC is the largest agricultural research facility in the country. The USDA proposed moving all BARC employees to five “hub” cities that the Department had selected.
The USDA has failed to demonstrate that any of the five hub cities meets the Department’s site-selection criteria better than BARC does. In fact, BARC is the best fit to these criteria, as this blog post shows. A department’s proposed action can be challenged and sometime blocked if the proposed action can be shown to be unlikely to achieve its stated purpose.
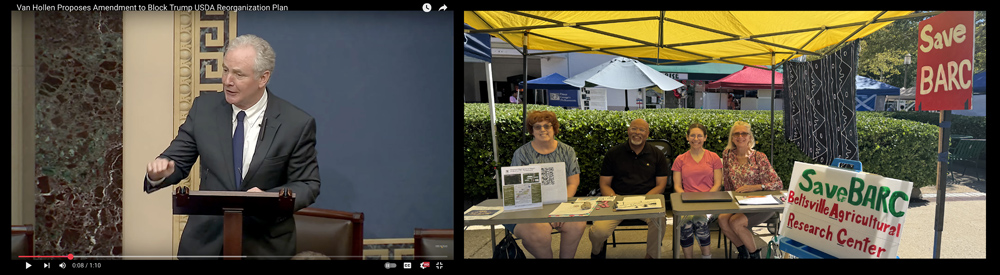
For the past two months, vacating BARC has been discussed in the corridors of power and on Main Street. The day after the USDA announced its plan to vacate BARC, the Department told the House Government Reform Committee that it had “no data or analysis backing up the decisions outlined in the July 24th memo to share.” On July 28, the mayors of four towns near BARC called for an economic and scientific impact report.[1] On August 1, Senator Van Hollen took the Senate floor to introduce a budget amendment that would require the USDA to publish an analysis before moving employees from the DC area.[2] Van Hollen’s amendment came within a few votes of passing. Meanwhile, the Save BARC citizens group was out interacting with the community, including at the Greenbelt farmers’ market and Greenbelt’s Labor Day festival.
USDA’s criteria for locating large facilities
When the task at hand would benefit from it, the USDA scatters its employees across the country. For example, the Department has about 2,300 small offices nation wide for employees who give face-to-face assistance to farmers. Similarly, the Department funds food-assistance programs in all 50 states and these programs are 62% of the USDA’s budget.[3] The people who administer these funds are state employees.
In contrast, the USDA sees an advantage to having two categories of USDA employees work in large groups located in cities that meet certain criteria. These employees administer national programs or carry out agricultural research. The goal is to encourage collaboration. Despite this goal, certain aspects of research can be accelerated by spreading it out. For this reason, the USDA Agricultural Research Service (ARS) operates over 90 facilities across the country and the USDA funds research at many universities.
Specifically, the USDA has established the following four criteria for where best to concentrate agricultural researchers and program administrators.
First, these USDA employees are more productive if they work within a critical mass of other USDA employees and near other people working in related fields.[4] Having top-notch research universities nearby also fosters collaboration and discoveries.[5]
Second, the USDA believes that its employees work best if they are located in places that foster a high quality of life. The Deputy Secretary of Agriculture focused on average home price when he explained the Department’s reasoning to the Senate on July 30, 2025. He said that, if a USDA job is located where an employee can afford to raise a family, then he or she is more likely to stay with the agency long enough to learn to do the job well.[6]
The third criteria is proximity to farmers. Relocating USDA employees closer to farmers is warranted only if the benefits to the American people can be shown to outweigh the cost and disruption to USDA productivity that would be associated with the relocation. Furthermore, this criteria is problematic because relocating a set of USDA employees closer to some farmers would necessarily mean moving these employees farther away from other farmers. (See the discussion in Appendix B.)
Fourth, the USDA should be financially responsible when choosing office locations.[7] For example, the Department should avoid renting office buildings when less expensive and equally serviceable government-owned buildings are available. The Department should spend the necessary funds so that USDA employees can work in buildings that are in a good state of repair.[8]
The rest of this blog post will examine how BARC measures up against these four criteria, taking them one at a time.
BARC is a great location for research
First, let’s look at the collaboration potential at BARC compared what exists at the five hub cities proposed by the USDA on July 24, 2025. USDA research is related to the work of the Food and Drug Administration, NOAA’s weather forecasting, NASA’s satellite observations, and the economic and global-trade research done at the Federal Reserve.[9] As shown in Table 1, BARC is less than an hour away from major facilities run by each of these organizations. In contrast, Indianapolis and Raleigh have no such facilities nearby. The other hub cities have major facilities nearby in one or two of these categories.
| Location | Food/medical research | NOAA, NASA centers | Economic research |
| BARC located next to the City of Greenbelt in Prince George’s County, Maryland | •FDA White Oak Center (8 miles away, 9,000 employees) •Additional FDA labs in Rockville and Deerwood, MD (30 miles away) •NIH (14 miles, 25,000 employees) | •NWS NCWCP (4 miles away, 825 employees) •NOAA Silver Spring Campus (11 miles away) •NASA Goddard Space Flight Center (adjacent, 10,000 employees) | •Federal Reserve headquarters (20 miles, 3,000 employees) •World Bank (20 miles, 6,000 employees) •International Monetary Fund (20 miles, 2,800 employees) |
| Salt Lake City, Utah | none | •NOAA NWS Western Regional HQ | •Branch office of San Francisco Fed. |
| Fort Collins, Colorado | none | •NOAA NCEI (50 miles) •NOAA NCAR (50 miles) | none |
| Kansas City, Missouri | •FDA Human and Animal Food Lab •USDA Economic Research Service (231 employees) | none | •Federal Reserve Bank of Kansas City |
| Indianapolis, Indiana | none | none | none |
| Raleigh, N. Carolina | none | none | none |
Next, look at the possibility of collaboration with nearby universities. Within an hour’s drive of BARC, there are nine highly ranked universities. The five hub cities each have only one to three such universities this close. Table 2 includes only universities that have at least a thousand students, that are within 50 miles of a hub city, and that rank among the nation’s top 200 universities according to US News and World Reports.[11]
| University near BARC or a proposed USDA hub (zip code) | Number of students | National Rank |
BARC in Beltsville, Maryland (20705) | ||
| University of Maryland, College Park a | 30,608 | #44 |
| Catholic University of America | 3,139 | #171 |
| Howard University | 10,190 | #86 |
| American University | 7,817 | #91 |
| George Washington University | 11,387 | #63 |
| University of Maryland, Baltimore County | 10,490 | #144 |
| John Hopkins University | 6,090 | #6 |
| George Mason University b | 27,666 | #109 |
| total: | 107,387 | |
Salt Lake City, Utah (84102) | ||
| University of Utah | 26,827 | #136 |
| Brigham Young University b | 32,211 | #109 |
| total: | 59,038 | |
Fort Collins, Colorado (80525) | ||
| Colorado State University a | 26,168 | #148 |
| University of Colorado, Boulder | 32,100 | #98 |
| total: | 58,268 | |
Kansas City, Missouri (65105) | ||
| University of Kansas, Laurence | 20,696 | #152 |
Indianapolis, Indiana (46204) | ||
| Indiana University, Indianapolis | 17,037 | #196 |
Raleigh, North Carolina (27608) | ||
| North Carolina State University | 27,323 | #58 |
| Duke University | 6,488 | #6 |
| University of North Carolina, Chapel Hill | 20,880 | #27 |
| total: | 54,691 |
b George Mason University and Brigham Young University are tied in the rankings.
BARC is a great location for quality of life
There is no universally accepted formula for measuring someone’s quality of life, but each of the five hub cities proposed by the USDA have multiple black marks against them that relate to quality of life. Table 3 compares the hub cities against Prince George’s County where BARC is located. The hub cities each have some combination of a higher crime rate, more fentanyl deaths, and a higher rate of depression or cancer. Residents of two of the hub cities also have a life expectancy that’s about 3 to 5 years shorter.
Most of the statistics in Table 3 are calculated by county, which means the county that either contains the hub city or at least the city center if the city is a sprawling metropolis. Appendix C provides background information on the data shown in Table 3.
| Quality-of-life variable | Salt Lake City (Salt Lake County), Utah | Fort Collins (Larimer County), Colorado | Kansas City (Jackson County), Missouri | Indianapolis (Marion County), Indiana | Raleigh (Wake County), N. Carolina |
| 1. Average house price | More expensive | More expensive | Housing and average salaries lower | Housing and average salaries lower | Similar to PG County |
| 2. Fentanyl overdose deaths per year | Higher (293/year) | Higher (421/year) | |||
| 3. Cancer rates (percent of population) | Higher (8.5%) | Higher (7.5%) | |||
| 4. Percentage of people reporting they have fair or poor health | Higher (20%) | Higher (21.8%) | |||
| 5. Depression rate, % of population | Higher (27.2%) | Higher (26%) | |||
| 6. CNBC 2025 ranking of best states for doing business (Maryland was the 27th best state) | 5th worse state in USA | 11th worse state in USA | 3rd worse state in USA | ||
| 7. Crime rate | 25% more property crime | 80% more violent crime and 12% more property crime | 80% more violent crime and 15% more property crime | ||
| 8. Life expectancy (years) | 2.7 years shorter | 4.6 years shorter |
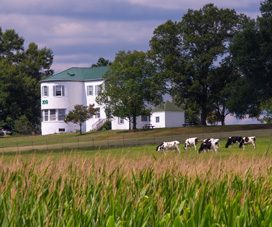
BARC is close to farmers
BARC is in the middle of a diversified farm economy
A wide range of farming occurs within a few hours’ drive of BARC. Most of Maryland’s congressional delegation made this point in a letter to the USDA on August 22, 2025:
“Located close to freshwater and saltwater, mountains and costal lowlands, and situated within the fertile Piedmont Plateau, BARC is within reach of diverse landscapes and a range of climatic conditions. This geography makes it an ideal location for an agriculture research station.”
The USDA itself has stated that it wants to serve all types of agricultural producers, including commodity farmers, specialty-crop farmers, and ranchers. In her July 24 memorandum, the Secretary of Agriculture said that the Department’s core mission includes making the Department’s programs “work for all of American agriculture.” [12]
Table 4 demonstrates that Delmarva is strong in many types of agriculture. By these measures, Delmarva has a more diversified agricultural economy than do the states that contain the five hub cities. For those unfamiliar with the term, Delmarva is the region that consists of Delaware, Maryland, and Virginia. It is about the same size as an individual state out West. The data in Table 4 comes from the USDA’s 2017 Census of Agriculture.
</div.
| Agricultural product | Delmarva | (Rank) | Utah | Colorado | Missouri | Indiana | N. Carolina |
animal a | |||||||
| chickens | 832 million | (2nd) | 4 million | 38 million | 286 million | 45 million | 833 million |
| aquaculture | $109 million | (1st) | $9 million | $16 million | $13 million | $6 million | $31 million |
| cattle inventory | 1.7 million | (3rd) | 0.8 million | 2.8 million | 4.1 million | 0.8 million | 0.8 million |
specialty b | |||||||
| tree nuts | 121 | (2nd) | 14 | 0 | 23 | 2 | 135 |
| vineyards | 30 | (1st) | 3 | 4 | 12 | 5 | 19 |
| barley | 55 | (2nd) | 19 | 65 | 2 | 1 | 11 |
| orchards | 23 | (1st) | 9 | 6 | 15 | 3 | 12 |
| vegetables | 86 | (2nd) | 7 | 79 | 18 | 40 | 155 |
commodities b | |||||||
| corn | 1,004 | (4th) | 36 | 1,306 | 3,365 | 5,402 | 843 |
| soybeans | 1,290 | (4th) | 0 | 18 | 5,868 | 5,981 | 1,740 |
b The units are thousands of acres of each crop.
While corn and soybeans are the United States’ biggest crops, farmer struggle to make a profit growing them.[13] If the goal is to make farming less precarious, then the diverse farming in the states near BARC may show the way.[14]
The map below places Table 4 in context. The map shows the East Coast in light red and Delmarva in green. BARC is in Prince George’s County, which is shown in dark red. The five hub cities are located in the counties and states shown in dark blue and light orange, respectively. The annual value of agricultural products from these states is printed on the map.[15]
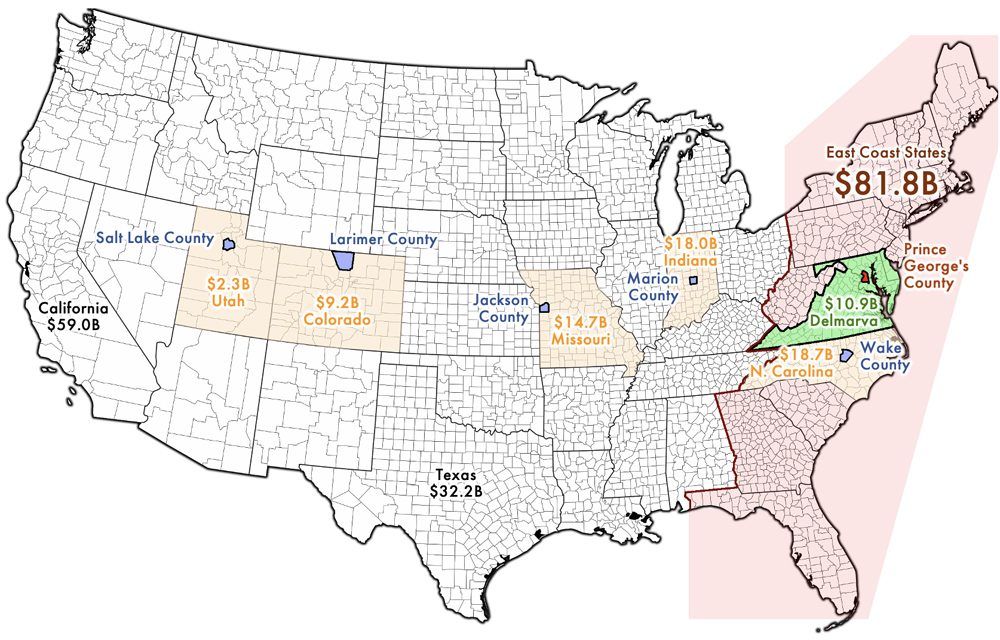
BARC is at the center of a farm economy with global significance
The United States East Coast has a globally significant farming economy, and BARC is near its geographic center. The East Coast certainly has a large enough farm economy to be a viable location for conducting agricultural research. If the East Coast were its own country, then its agricultural production would be the 9th largest of any country in the world. Generating $81.8 billion a year, the agricultural economy of the U.S. East Coast is larger than that of any country in Europe, Africa, or North America except for the United States. The East Coast’s farm economy is greater than that of Mexico ($59 billion), Canada ($47 billion), or France ($65 billion).[16]
One of the five hub cities (Raleigh, North Carolina) is like BARC centrally located within the East Coast. Being equally well located, however, would not justify the cost and disruption of relocating BARC research there.
Keeping research at BARC makes economic sense
The geographic distribution of USDA research spending
The fraction of United States residents who live in the East Coast is similar to the fraction of the USDA research budget that is currently spent in the East Coast. If BARC were vacated and the jobs moved away from the East Coast, then the Executive Branch would be taking an action that gave Americans living in the East Coast less than a fair share of the nation’s agricultural research.
| Variable | United States | East Coast states | Percent East Coast |
2024 population | 340.1 million | 127.7 million | 37.5% |
2024 Agricultural Research Service (ARS) funding for ARS facilities | $1.791 billion | $0.682 billion | 38.1% |
2024 National Institute of Food and Agriculture (NIFA) grants for research at state facilities | $2.162 billion | $0.571 billion | 26.4% |
If the USDA were to vacate BARC, the action would add to an existing pattern of federal disinvestment from large agricultural research facilities in the East Coast. The public and members of congress may not realize this pattern exists. Over the years, the news media have reported on individual events that contribute to this pattern, but the media haven’t pointed out the pattern itself. Consider the following facts.
BARC is the largest agricultural research facility in the country, but other USDA facilities are not far behind (Appendix A). In 2023, the country’s second largest agricultural research facility opened in Kansas, and this work was formerly done in a New York facility that is now closing.[18] If you consider the creation of agricultural economic statistics as research, then the next largest facility in the country is the USDA Economic Research Service office in Missouri. This economic work was moved from the District of Columbia to Missouri in 2019.[19] If you count only non-economic research, then the country’s third and fourth largest agricultural research facilities are in Iowa and Mississippi. These two facilities have seen their funding increase by 30% over the past 16 years, while BARC’s funding has increased by only 11.5% during this period.[20]
Vacating BARC would cause economic harm
In July 2025, the USDA claimed that vacating BARC and moving DC-area employees to the five hub cities would increase the Department’s value to the country. So far, the USDA has offered no analysis to support this claim. The simple calculation below suggests, in contrast, that vacating BARC would cause significant economic harm.
Prior work has found that the agricultural research conducted at the USDA generates about $17.50 of economic benefit for each $1 spent on research.[21] Consider that the GAO found that, when the USDA moved 644 DC-area office jobs to Kansas City in 2019, these agencies’ productivity was reduced for two years.[22] By 2021, the new hires had achieved the productivity of the experienced employees who had resigned in 2019 rather than accept relocation.
The ARS spends about $144 million annually at BARC.[23] Applying a 17.5-to-1 benefit-to-investment ratio, BARC research generates $2.5 billion of economic benefit to the nation. If relocating this agricultural research reduced productivity by 50% for two years or 25% for four years, then vacating BARC would cause $2.5 billion of economic harm.
Some agricultural research requires carefully calibrated equipment or fieldwork repeated over many years. For this reason, there is no guarantee that research productivity could recover just two years after a relocation, the way that the productivity of desk jobs recovered two years after the USDA’s 2019 relocation.

Vacating BARC would not save money on facility costs
The USDA has promoted its plan to vacate BARC by claiming that relocating these jobs would reduce the Department’s facility costs.[25] While no one has published a definitive analysis, the data presented below suggests that vacating BARC would generate no savings.
At the government-owned George Washington Carver office complex on the BARC campus, the USDA spends annually about $19.01 per square foot of floor space for building operations and maintenance.[26] It would cost more than that to rent office space in the five hub cities where the USDA proposes moving BARC research: $23 to $38 per square foot.[27]
If you look at the agricultural research facilities on the BARC campus, the USDA Agricultural Research Service (ARS) annually spends about $7,231 per employee for building operations and maintenance.[28] It would cost more than that to rent lab space in one of the five hub cities: at least $9,200 to $14,800 per researcher annually and maybe more than that.[29]
It’s difficult to estimate what the rental cost would be per researcher because biological and agricultural lab space is more expensive than ordinary office space. Looking at lab space offered for rent suggests the cost could be $24,000 to $82,000 annually per researcher.[30] This range is much higher than what the USDA currently spends, on average, to house research in government-owned buildings at BARC.
There is an intriguing possibility that the USDA, Congress, and the media have missed so far: keep all of BARC’s current employees at BARC and move several hundred more USDA employees to BARC. The cost to maintain a building is about the same whether it is partially or completely full. It is hard to tell from public information, but there may be some available lab and office space at BARC right now.[31] If a group of USDA employees already living in the DC area were moved from a rented office in DC to an empty office at BARC, that change would be essentially pure profit for the USDA’s facilities budget.
In his July 30, 2025, testimony before the Senate, the Deputy Secretary of Agriculture expressed eagerness that government office space not be wasted, so it’s odd that he didn’t propose maximizing BARC’s utilization.[32]
Contrary to what the Deputy Secretary of Agriculture led the Senate to believe, many of BARC’s buildings have been renovated in the past 25 years and are in a state of good repair. Appendix D contrasts the Deputy Secretary’s statements with facts.
It would be a shame if the government vacated these well-maintained government-owned buildings and started renting more expensive space in the hub cities. On August 24, 2025, Congressmember Glen Ivey and others made this point in a letter to the USDA:
“USDA has already invested more than $174 million in BARC facility upgrades and repairs. Abandoning a facility right after USDA has made such significant upgrades to it is illogical and wasteful. As one of the world’s largest agricultural research complexes, relocating personnel, as well as all the lab and research equipment, will undoubtedly be a major expense.”
Final thoughts
BARC ranks high in the criteria that the USDA has established for where program administration and agricultural research should be done. Vacating BARC does not make sense. This conclusion is reached using publicly available data. If the USDA should ever publish its own analysis of the pros and cons of vacating BARC, that report should be examined carefully.
At the time of writing, the public still has time to submit comments to the USDA on its plan to vacate BARC. On August 1, 2025, the USDA issued a press release that invited comments until August 26. After public outcry, the Department first extended the comment period to August 30, and then to September 30. There will be more chapters to this story after the public comment period ends.
Appendix A: Is BARC the largest agricultural research center in the United States?
Among the research facilities operated by the USDA Agricultural Researcher Service (ARS), BARC is the largest in terms of funding. At least BARC has the most funding if you include the funding for both the research buildings and the National Agricultural Library that is located on the BARC campus. Otherwise, the ARS facility in Manhattan, Kansas, would be the facility with the most ARS funding.
BARC is by far the largest ARS facility in terms of the number of people working there. The federal government counts employees using units of full-time equivalent (FTE) positions. The FTE and funding listed in Table A1 are taken from the ARS and ERS fiscal year (FY) 2026 budget justifications. Table A1 sorts facilities by their funding from most to least. The leftmost column (rank) is left blank for facilities that do not conduct scientific research. Such facilities instead perform headquarters functions or conduct economic research.
| ARS rank | FY2024 funding, millions of dollars | FTEs | Agency | USDA ARS facility name, state |
| — | $200.2 | 499 | ARS HQ | Headquarters, Federal Administration, District of Columbia |
| 1 | $178.1 | 593 | ARS | Beltsville, Maryland (including the National Agriculture Library) |
| 2 | $164.0 | 305 | ARS | Manhattan, Kansas |
| — | $63.4 | 219 | ERS | USDA Economic Research Service, Kansas City, Missouri |
| 3 | $60.0 | 325 | ARS | Ames, Iowa |
| 4 | $51.6 | 221 | ARS | Stoneville, Mississippi |
| 5 | $46.2 | 176 | ARS | Albany, California |
| 6 | $43.9 | 137 | ARS | Athens, Georgia |
| 7 | $37.7 | 108 | ARS | Fargo, North Dakota |
| 8 | $33.2 | 154 | ARS | Peoria, Illinois |
| 9 | $32.3 | 124 | ARS | Madison, Wisconsin |
| 10 | $31.8 | 138 | ARS | Wyndmoor, Pennsylvania |
| 11 | $28.4 | 120 | ARS | Pullman, Washington |
| 12 | $28.0 | 72 | ARS | College Station, Texas |
| 13 | $26.0 | 139 | ARS | Fort Collins, Colorado |
| 14 | $25.6 | 90 | ARS | New Orleans, Louisiana |
| 15 | $25.1 | 103 | ARS | Clay Center, Nebraska |
| 16 | $24.9 | 102 | ARS | Corvallis, Oregon |
| 17 | $22.3 | 66 | ARS | Mississippi State, Mississippi |
| 18 | $22.3 | 97 | ARS | Davis, California |
| 19 | $21.2 | 6 | ARS | Boston, Massachusetts |
Public information is contradictory about the first row of Table A1. In other words, it is unclear if most of the ARS headquarters staff actually have their offices at BARC or somewhere in the District of Columbia. The ARS budget document claims that all ARS headquarters staff work in DC, but the HQ ARS web page claims the ARS headquarters staff have their offices in Beltsville, Maryland. One of these documents has to be wrong or at least misleading.
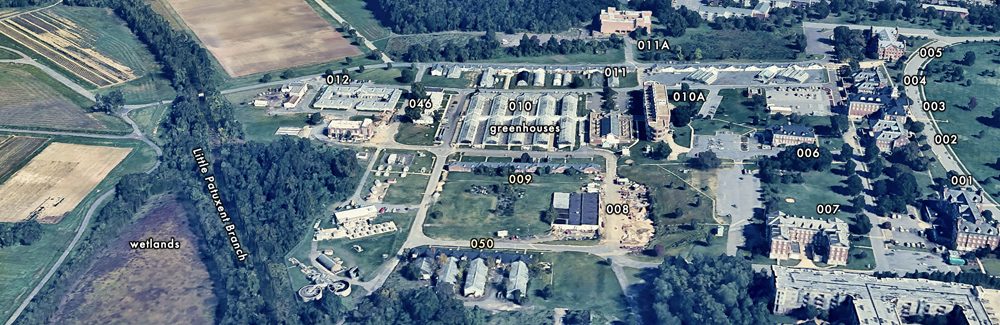
The present blog post considers the following facilities to be part of BARC because they are located on BARC’s campus: ARS research facilities in Beltsville, the National Agricultural Library, the Beltsville Human Nutrition Research Center (BHNRC), and the four buildings of the George Washington Carver office complex on Sunnyside Avenue in Beltsville. Various USDA documents use different definitions of BARC that exclude one or more of these units.
While BARC has the title of largest agricultural research facility in the United States, it may not be the largest in the world. The USDA reported that, twenty years ago, China spent half as much annually on agricultural research as the United States did, but 10 years ago, China was already spending twice as much as the United States.
The Chinese Academy of Agricultural Sciences (CAAS) reports it has 11,171 employees, while its counterpart in the United States (USDA ARS) had 6,285 employees in 2024. It is possible that one of the CAAS facilities is or will soon be larger than BARC because many USDA ARS employees have resigned or were fired since Trump took office in January 2025.
Appendix B: Moving the USDA closer to the farmer
A relocation of USDA employees can only be justified if it brings benefits to the country as a whole. According to the USDA’s mission statement, its mission is to “serve all Americans by providing effective, innovative, science-based public policy leadership in agriculture” and related areas. The USDA advances the interests of the American people by conducting research that improves the food supply, cures crop diseases, reduces the cost of agricultural production, or that helps expand agricultural trade with other countries.
It is unclear that “moving researchers closer to the farmer” is an idea that makes sense. To the extent that it does make sense, a physical relocation of a group of researchers could only be justified if it were shown it would advance the interests of the American people in the ways listed in the preceding paragraph. In other words, if changing a researcher’s place of employment would delay discoveries that would improve the food supply and cure crop diseases, then such a move would be unwarranted.
It is common sense that moving a researcher from BARC to someplace out West actually moves that researcher farther away from some farmers (i.e., the farmers on the East Coast) and closer to other farmers (i.e., the farmers out West). Moving a researcher doesn’t make him or her closer to all farmers.
To a degree, the current leadership of the USDA acknowledges that the USDA’s mission is to serve the interests of the American people. On July 24, 2025, the Secretary of Agriculture wrote that the Department provides services that “benefit all Americans.” On Fox News the next day, she said she wanted to bring the Department
“closer to our constituents: the farmers, the ranchers, the producers, the fire fighters—the USDA has the largest firefighting contingent in America; we fight the wildfires out across the west of our country—our food stamp program. All of the above. Improving our closeness to the people in America.” [33]
But at the same time, the USDA leadership seems to want us to believe two silly or unproven ideas: the only farmers that matter live out West and moving a researcher geographically closer to them would accelerate the rate of scientific discoveries.
Senators representing states outside the East Coast are actively promoting these two ideas. For example, Senator John Hoeven of North Dakota said:
“I support the idea of moving people out of the DC area and out into the field and closer to the farmer. And of course, the ultimate goal has to be better service to our farmers and ranchers across ag country.” (Senate hearing, July 30, 2025, 27:55)
Similarly, Senator Marshall of Kansas said the following to Deputy Secretary Vaden:
“I just can’t help but think, when you have people working for USDA going to church, going to the soccer match, all that type of thing, with the local farmers and ranchers, it’s going to be better service as well. So just talk about customer service. How that’s going to be impacted by these people moving out into the hinterlands, as we call it.” (Senate hearing, July 30, 2025, 1:04:00)
The Deputy Secretary responded: “Well, I don’t consider it the hinterlands, I consider it home, senator. But with regard to having more people in the field, we agree with you.” At the same hearing, Senator Adam Schiff of California commented that the USDA had communicated the goal of “USDA offices and services moving closer to American farmers” (1:31:35).
Contrary to what the USDA leadership would have you believe, it is fair to say that BARC is located “in the field” because it is located outside of the District of Columbia on ten square miles of field and forest in Prince George’s County, Maryland. It is unclear how Senator Hoeven defines “ag country,” but East Coast farmers create $81 billion of agricultural products each year, which suggests the East Coast qualifies as ag country.[34] BARC is near the geographic center of the East Coast.
Appendix C: Background on quality-of-life statistics
This appendix explains the values shown in Table 3 of the main text of this blog post. In row 1 of Table 3, average house price by county is calculated from Zillow.com as previously reported on Greenbelt Online.
Row 2 of Table 3 is based on CDC reports of fentanyl deaths per year in 2024: Prince George’s County, MD, 187 deaths; Salt Lake County, 293 deaths; Larimer County, CO, 52 deaths; Jackson County, MO, 23 deaths; Marion County, IN, 421 deaths; and Wake County, NC, 160 deaths.
Rows 3 through 5 of Table 3 are based on U.S. Census data available by visiting ArcGIS. Click on a county and select “Table.” Table C1 provides a summary of these values. Where a hub city has a worse value than the value for Prince George’s County, Maryland, that value is printed with a bold-face font in Table C1.
| Quality-of-life variable | BARC (Prince George’s County), Maryland | Salt Lake City (Salt Lake County), Utah | Fort Collins (Larimer County), Colorado | Kansas City (Jackson County), Missouri | Indianapolis (Marion County), Indiana | Raleigh (Wake County), N. Carolina |
Cancer rates, % of population | 5.4% | 6.8% | 8.5% | 7.5% | 6.7% | 6.9% |
| Percentage of people reporting they have fair or poor health | 17.8% | 15.4% | 11.3% | 18.1% | 21.5% | 12.6% |
| Depression rate, % of population | 14% | 27.2% | 26% | 22.7% | 23.3% | 20% |
Row 6 of Table 3 is based on the CNBC 2025 ranking of states by how business friendly they are.
Row 7 of Table 3 is based on FBI nation-wide crime and population statistics. The raw data was downloaded as a CSV file by visiting https://cde.ucr.cjis.gov/ and clicking on the link called “Source Data”. Table C2 sums the crime rates reported by the various police departments that have jurisdiction in one of the hub cities or in Prince George’s County.
| Location: Police departments with jurisdiction | Population | Property crimes | Violent crimes |
| Prince George’s County, Maryland: Berwyn Heights, Bladensburg, Brentwood, Capitol Heights, Cheverly, Colmar Manor, Cottage City, District Heights, Edmonston, Fairmount Heights, Forest Heights, Glenarden, Greenbelt, Hyattsville, Landover Hills, Laurel, Morningside, Mount Rainier, Prince George’s County Police Department, Riverdale Park, Seat Pleasant, Upper Marlboro, University of Maryland, University Park, Maryland-National Capital Park Police, Bowie State University, Prince George’s County Community College, New Carrollton, and Bowie | 954,000 | 24,972 | 4,430 |
| Salt Lake City, Utah: Salt Lake, Murray, Salt Lake City, South Salt Lake, Sandy, West Jordan, University of Utah, Draper, Riverton, South Jordan, Bluffdale, Alta, West Valley, Granite School District, Taylorsville City, Utah Transit Authority, Cottonwood Heights, Herriman, and Department of Natural Resources | 975,000 | 31,168 | 4,059 |
| Fort Collins, Colorado: Larimer, Estes Park, Fort Collins, Loveland, Colorado State University, Northern Colorado Drug Task Force, and Timnath | 363,000 | 7,090 | 1,025 |
| Kansas City, Missouri: Kansas City, Raytown, Grandview, North Kansas City, and Gladstone | 599,000 | 28,031 | 8,215 |
| Indianapolis, Indiana: Indianapolis, Beech Grove, Lawrence, Speedway, Indianapolis International Airport, Cumberland, University of Indianapolis, Indiana Office of Inspector General, and Indianapolis Public Schools | 975,000 | 28,920 | 8,098 |
| Raleigh, North Carolina: Wake, Raleigh, Cary, Fuquay-Varina, Garner, Knightdale, Wake Forest, Wendell, and Zebulon | 1,060,000 | 20,311 | 3,298 |
Row 8 of Table 3 is based on county-level average life expectancy taken from the County Health Rankings website: United States, 77.1 years; Prince George’s County, MD, 77.6 years; Salt Lake County, 78.6 years; Larimer County, CO, 80.5 years; Jackson County, MO, 74.8 years; Marion County, IN, 73.0 years; and Wake County, NC, 81.0 years.
Appendix D: BARC Renovations
At the July 30, 2025, Senate hearing, Deputy Secretary Vaden said that the USDA reorganization plan announced on July 24 would “save at least 2.2 billion dollars by ditching these national capital region facilities that are out of date and in disrepair” (1:17:54). Since vacating all the buildings of BARC except the library is part of the USDA’s plan, Vaden is implying that all the buildings at BARC are in disrepair. He expressed this idea more fully 52:42 minutes into the hearing:
“at the four buildings that the [July 24] secretary’s memorandum proposed to vacate, the value of deferred maintenance on those buildings, the liability on USDA, is 2.2 billion with a ‘B’ dollars, hard to conceive, but that is the calculation when you add those four buildings together of how much maintenance they need to bring them up to modern standards.”
In the above quote, it is unclear what four buildings Vaden is referring to. In actual fact, the July 24 secretary’s memorandum did not mention vacating four buildings. Instead, the memorandum mentioned vacating almost all the buildings at BARC including the Carver office complex but not the library, vacating one building in the District of Columbia on Independence Avenue, and vacating one building in Alexandria, Virginia.
Deputy Secretary Vaden chose to omit from his testimony the fact that many of the large buildings in use on BARC’s campus have been renovated during the past 25 years and are not in disrepair. In recent years, $174 million of renovations have been done to BARC buildings, as stated in a letter on August 22, 2025, from most of Maryland’s congressional delegation.
Below, Table D1 lists BARC renovation projects during the past 25 years. Excluding infrastructure and utility repairs, the BARC building renovations during the past 25 years were done at an average cost of $449 per square foot ($395.4 million / 881.5e3 ft2). The data is taken from multiple sources but primarily from the USDA annual budget explanatory notes for the Agricultural Research Service (ARS). The Grunley Construction Company says that it has worked on three renovation projects at BARC in recent years: $75.4 million for the Carver Center renovation that was awarded in 2020, $46.8 for the Building 002 renovation in 2021, and $42.1 million for the Building 005 renovation awarded in 2023.
| Renovation | Space | Cost | Years | Reference [b] | |
| Building 002 | 34,000 ft2 | $25.0 million + $12.3 million shared among buildings 002, 005, and 008 [b] | 2021–present | FY 2020, 2021, 2023 | |
| Building 005 | 52,580 ft2 | $46.0 million | 2022–present | FY 2022, 2023 | |
| Building 308 | 42,900 ft2 [a] | $0.5 million | 2023–present | FY 2023 | |
| George Washington Carver office complex | 350,000 ft2 | $75.4 million | 2020–2022 | sam.gov | |
| Infrastructure | — | $5.4 + $167.0 million | 2023, 1998–2010 | $5M in FY 2023, $167M in FY2011 | |
| Building 306 | 60,000 ft2 | $14.6 million | 2009–2018 | ARS (2012) | |
| National Agriculture Library | 275,000 ft2 | $15.9 million | 1998–2009 | FY 2019 | |
| Building 307 | 67,000 ft2 | $205.8 million | 2010–2016 | FY 2019 | |
| Building 304 | 26,000 ft2 [a] | [unknown] | 1997–2002 | reopening | |
| Total | 906,000 ft2 | $567.9 million |
[b] Most references are to the ARS budget justification for a particular fiscal year (FY).
There is consensus that our nation’s infrastructure is crumbling.[35] One part of this problem is that many of the nation’s agricultural research facilities are crumbling according to industry groups and academia. In contrast, the USDA has invested millions to renovate hundreds of thousands of square feet of lab and office space at BARC. It would be prudent to make full use of these buildings to advance American agriculture.
[1] The letter from the Four Cities Coalition on July 28, 2025, was signed by the mayors of Berwyn Heights, College Park, Greenbelt, and New Carrollton, Maryland.
[2] Had amendment #3115 passed, section (a) would have blocked funding for the USDA’s reorganization plan:
“None of the funds made available to the Department of Agriculture in this Act or any other Act may be used to implement the Department of Agriculture memorandum issued on July 24, 2025 (relating to the Department of Agriculture reorganization plan) (referred to in this section as the ‘Memorandum’), or any similar plan relating to reorganization of the Department of Agriculture.”
Section (b) would give the Secretary of Agriculture 90 days to publish a cost-benefit analysis of any planned reorganization. Section (c) would give the secretary 120 days to publish a report that describes “how that reorganization will retain sufficient staff expertise to carry out Department of Agriculture mission areas and result in greater efficiencies and customer service for agricultural producers and other communities.” The same day that Senator Van Hollen proposed this budget amendment, 43 senators voted for it, which was almost enough for it to pass.
Additional discussions occurred in August 2025. On August 7, 2025, members of the House Government Oversight Committee expressed “significant areas of concern about USDA’s level of analysis or lack thereof into the impacts of the [USDA reorganization] plan.” On August 22, 2025, most of Maryland’s delegation to Congress sent a letter to the Secretary of Agriculture that stated: “Americans deserve an accurate, transparent assessment that analyzes both the costs and benefits of the proposed USDA reorganization plan before any action is taken to close BARC and the other National Capitol Region facilities.” On August 28, most of Maryland’s delegation to Congress issued a press release asserting that the USDA’s plan to vacate BARC would “irreparably undermine U.S. agricultural innovation and harm the countless farmers who depend on BARC’s research.”
[3] In FY 2024, the USDA spent $142.2 billion on food-assistance programs in a budget with total outlays of $228.3 billion. At the July 30, 2025, Senate Hearing, USDA Deputy Secretary Vaden said, “Speaking of where USDA reports to work, USDA has a total of 4,754 facilities at which its employees report to work each and every day” (10:40). To give context, that number is greater than the number of counties in the entire United States. In 2024, the U.S. Census reported that there were 3,144 counties or county-equivalent units in the United States.
[4] At the July 30, 2025, Senate Hearing, Deputy Secretary Vaden talked about consolidation as a criteria for picking a location for USDA employees: “if we are looking to relocate, the first thing we should do is see where we already are and we already have office space available and of core set of employees” (29:16). He said further that the Department wanted to “spark that level of collaboration” (1:02:00).
Congressmembers agree there are benefits to this sort of proximity. A group of them made this assertion in a letter to the USDA on August 22, 2025:
“there exists an ecosystem of support services that helps BARC run efficiently. From equipment installation and calibration to maintenance and repair—BARC’s location allows it to easily access and share these types of support services that are already available in the greater Washington, D.C. area given the high density of scientific research that occurs there. In addition, the area has a large number of federal contractors who are skilled at supporting BARC’s day-to-day operations.”
BARC senior scientists say there are benefits of multi-disciplinary science, cross-cutting collaboration, and convergent research: Beltsville Distinguished Senior Research Scientists Committee, January 31, 2025, A Vision for Long-Term Scientific Leadership in Beltsville, USDA web page.
[5] Senator Roger Marshall (Republican from Kansas) opined that one of the hub cities would be a good location for moving USDA employees to because it has several universities within a two-hour drive and the city is “just miles” from “some of the greatest ag research in the world” (Senate hearing, July 30, 2025, 1:02:04). USDA Deputy Secretary Vaden said that the advantage of being near a major university, such as Colorado State University, is that the proximity makes it “easier to collaborate and it’s easier to multiply efforts, and it’s that in-person collaboration that we are trying to spark” (34:45). Later in the hearing, Vaden reinforced this point:
“We want spark that level of collaboration that you have noted, whether it be with our land grant or non-land grant university partners, whether it be with individual farmers, whether it be the local chamber of commerce in an area that is driven and motivated, even though it may be in an urban setting, by agriculture.” (1:02:00)
In January 2025, senior scientists at BARC mentioned collaboration with local universities.
[6] On July 30, 2025, Deputy Secretary Vaden said, “our principal consideration for where to put our regional hubs was the cost of living. We want people to come to USDA for a career, to start a family, and to stay with us” (16:00). He said that the city where USDA employees work influences whether they can “afford to start a quality life” on a government salary (22:00). Also, he said, “we want people to join USDA to build a career, to be able to purchase a home” (1:32:35).
[7] A group called “Agriculture Buildings and Facilities” is in charge of building maintenance for BARC’s George Washington Carver office complex and for the USDA’s government-owned and leased building in the District of Columbia. In May 2025, this group published a budget document that said it would seek the “efficient utilization of space.” It would do so in the “most cost-effective manner by reducing the USDA footprint in the NCR [National Capital Region] and reducing agencies’ dependency on leased facilities.”
[8] Consolidation to achieve “cost savings for the American people” was one of the stated purposes of the July 24, 2025, secretary’s memorandum that announced the plan to vacate BARC. In the Secretary of Agriculture’s July 24 pre-recorded video address to employees, she said the reorganization plan included “shedding a number of leases and buildings.” At the July 30 senate hearing about the reorganization plan, USDA Deputy Secretary Vaden said the USDA should end some office-building leases and get rid of government-owned buildings if there are more buildings than are needed given the number of USDA employees (11:40). At the hearing, Deputy Secretary Vaden also mentioned the cost of “deferred maintenance” on buildings (54:42).
[9] Deputy Secretary Vaden said the USDA will “take advantage of all these synergies” with universities, farmers, local chambers of commerce, and Federal Reserve offices near USDA employees (Senate hearing, July 30, 2025, 1:02:00). In January 2025, senior scientists at BARC mentioned collaboration with the Food and Drug Administration (FDA), NASA, the National Institutes of Health (NIH), the Department of Energy (DOE), and the EPA.
[10] Table 1 does not include federal facilities with fewer than 200 employees. An FDA map shows the locations and types of FDA facilities. The FDA White Oak facility was built for an 8,889 person workforce. In 2023, NIH had about 25,000 employees in its Bethesda, Maryland, offices. There were 2,963 civil servants working at NASA Goddard in FY 2024, but if you include contractors working on or near the facility, the total number of employees was approximately 10,000. NCWCP has 825 employees. NOAA published a map of its locations. About half of the World Bank’s 12,000 employees work in its DC headquarters as of 2019. The Federal Reserve had about 3,000 employees in DC as of 2024. It has published a map of its locations. The IMF has 90% of its 3,100 employees in DC.
[11] U.S. News and World Reports has a searchable list of the 436 universities that it considers “national universities.” On the website, one can sort the list by increasing distance from a user-selected zip code. The UnitedStatesZipCodes.org website allows you to determine the zip code for a particular city. The zip codes used to calculate distance for Table 2 were the zip codes for BARC, for a hub city, or at least for the central portion of a hub city.
[12] The issue of the USDA needing to support a diversified mix of agriculture was also raised by Senator Peter Welch (Democrat from Vermont) during the July 30 Senate hearing on the USDA reorganization. He said, “It’s really essential to a lot of farmers that their non-commodity orientation be respected and be supported and be encouraged” (1:01:04). In the exchange with Senator Welch, Deputy Secretary Vaden said, “We want all farmers—traditional, organic, specialty crop, commodity crop—to make a profit and to do well” (1:00:15).
[13] On January 14, 2025, Paulson et al. predicted that corn and soybean farmers will lose money three years in a row (2023–2025). There is economic danger if U.S. farmers rely too much on only two crops, corn and soybeans: Patrick Thomas, Stephanie Stamm, and Elizaveta Galkina, September 1, 2025, Corn and Soybeans Rule the American Farm. Why That’s a Growing Problem, in Charts, Wall Street Journal. In 2022, the total market value of the United States’ agricultural products was $280 billion, of which 51% ($144 billion) came from corn and soybeans: USDA, 2022, Census of Agriculture, Table 2, “Market Value of Agricultural Products Sold Including Food Marketing Practices and Value-Added Products: 2022 and 2017.”
[14] On November 15, 2024, the Western Producer article by Sean Pratt praised crop diversification. See also the Diverse Corn Belt website and Traldi et al., 2024, “Safer to plant corn and beans?” Navigating the challenges and opportunities of agricultural diversification in the U.S. Corn Belt, Agriculture and Human Values, 41, https://doi.org/10.1007/s10460-024-10570-7.
[15] The USDA published the value of agricultural output by state in 2022.
[16] The Our World in Data website summarizes the value of agricultural output by country in 2023 based on United Nations data. The USDA published the value of the agricultural output of East Coast states in 2022.
[17] Population data from U.S Census Bureau, December 2024, State Population Totals and Components of Change: 2020-2024, Excel spreadsheet, “Annual Estimates of the Resident Population for the United States, Regions, States, District of Columbia and Puerto Rico: April 1, 2020 to July 1, 2024 (NST-EST2024-POP)”.
ARS and NIFA funding in the categories shown in Table 5 of the present blog post are less than the agencies’ total budget. ARS FY 2024 research spending associated with specific facilities is found in Table ARS-14 titled “Geographic Breakdown of Obligations and FTEs for Agricultural Research” from USDA, May 30, 2025, 2026 USDA Budget Explanatory Notes. NIFA FY 2024 research grants to states is found in Table NIFA-8 titled “Research at State Agriculture Experiment Stations & Other State Institutions” from USDA, May 30, 2025, 2026 USDA Budget Explanatory Notes.
[18] The second largest agricultural research facility in the U.S. is now the recently constructed National Bio and Agro-Defense Facility (NBAF) that opened in 2023 in Manhattan, Kansas. NBAF has a 48-acre campus with 700,000 square feet of office space. The work now being done at NBAF was formerly done in New York at the Plum Island Animal Disease Center (PIADC). PIADC is being closed according to the Greenwich Time website.
[19] Prior to 2019, the USDA Economic Research Service was located entirely in the District of Columbia. As of 2024, 291 of the agencies’ 312 employees were located in Kansas City, Missouri: Table ERS-7 of the ERS FY 2026 budget justification.
[20] In FY 2009, the USDA Agricultural Research Service (ARS) spent $38.0, $48.4, and $144.8 million on research in Stoneville, Mississippi; Ames, Iowa; and Beltsville, Maryland, respectively, according to the ARS FY 2011 budget justification. In 2025, the USDA expects to spent $50.7 million on Stoneville, $63.1 million on Ames, and $144.7 million on research at BARC plus $28.5 on the National Agriculture Library that is on BARC’s campus. Over this 16-year period, funding at Ames and Stoneville increased 30%–33%. If you include funding for the library at BARC, then total funding at BARC increased 11.5% during the same period, and otherwise, BARC funding didn’t increase at all. During these 16 years, the Consumer Price Index has increased by 50%.
[21] $17.5 of economic benefit from each $1 spent on research conducted by USDA according to Julian Alston et al., 2011, The economic returns to U.S. public agricultural research, American Journal of Agricultural Economics, 93, page 1267. An earlier study by the USDA suggested a 10:1 ratio of economic benefit to agricultural-research dollars spent: Fuglie and Heisey, 2007, Economic Returns to Public Agriculture Research, USDA Economic Research Service, brief no. 10. The point of the present blog post stands regardless of whether one uses a 17.5:1 or 10:1 ratio. For related economic estimates, visit this USDA web page: Agricultural Research and Productivity.
[22] In 2022, a GAO report stated that the USDA relocation in 2019 reduced productivity:
“Coinciding with the loss of staff in fiscal years 2019 and 2020, ERS produced fewer key reports, and NIFA took longer to process grants. By the end of fiscal year 2021, however, agencies’ workforce size and productivity had largely recovered. Two years after the relocation, the agencies’ workforce was composed mostly of new employees with less experience at ERS and NIFA than the prior workforce.”</p.
At the July 30, 2025, Senate hearing on the USDA reorganization plan, Senator Klobuchar (Democrat from Minnesota) said that the USDA relocating two agencies from DC to Kansas City in 2019 resulted in “a massive brain drain and significant loss of productivity at both agencies.”
To the review the timeline, the USDA requested an “Expression of Interest” in August 2018 from potential cities to host two agencies: Economic Research Service (ERS) and the National Institute of Food and Agriculture (NIFA). NIFA is an agency whose primary purpose is fund research at state-run institutions. On June 13, 2019, the USDA published an 11-page cost-benefit analysis for the relocation that it planned to perform that fall. The relocation occurred in September 2019. In December 2022, the U.S. General Accounting Office (GAO) published its report criticizing the relocation.
[23] In FY 2024, the USDA Agricultural Research Service spent $144 million on BARC research, not including the $33 million it spent to maintain the National Agriculture Library that is located on BARC’s campus. Source: 2026 USDA Explanatory Notes – Agricultural Research Service.
[24] BARC research contributed to the poinsettia industry: John Hammond, 2008. The cultivars that existed in the 1960s, before BARC became involved, had their bright red leaves fall off after a few days, which limited the plant’s popularity: Kim Kaplan, 2015. Geneticist Robert Stewart was one of the BARC researchers who turned the poinsettia into a commercial success: obituary, Friends of Agricultural Research, 2008.
[25] Generating “cost savings for the American people” is one of the stated purposes of the USDA reorganization plan that was announced on July 24, 2025. This plan includes vacating BARC.
[26] The facilities budget specifically for the Carver office complex at BARC is $6.968 million in FY 2023 and the same amount is estimated for FY2025 (Table AgBF-6). This cost is not within the ARS budget and instead in a separate account called “Agriculture Buildings and Facilities.” USDA keeps secret the number of employees stationed in the Carver office complex, but it does state the office complex’s floor space: 350,000 ft2. Dividing these two numbers, we arrive at the facilities cost per square foot for the Carver office complex: $19.91/ft2 ($6.968 million / 350,000 ft2).
[27] The Commercial Cafe website estimates, in September 2025, that the average cost to lease class-A office space in Kansas City is $29.15 per square foot per year. Newmark Zimmer estimated the average cost in Kansas City was $24.30/ft2 in the first quarter of 2024: Kansas City Office Market Overview, page 18. Colliers estimated that the average cost was $23.39/ft2 in Kansas City on December 31, 2023. In Indianapolis, Indiana, the cost to rent class-A office space is similar to that in Kansas City: in 2025 is was $28.77/ft2, and in 2023, it was $22.90/ft2 (Newmark) to $25.98/ft2 (Colliers). According to the Commercial Cafe website, office space in 2025 rents for $22.71/ft2 in Fort Collins (class not specified), $32.44/ft2 in Salt Lake City (class A), and $37.90/ft2 in Raleigh (class A).
[28] Nationwide, the USDA Agricultural Research Service (ARS) spent 2.6% of its 2024 budget on building and facility maintenance ($42.5 million out of a $2.21 billion budget). In 2024, the ARS spent $144.7 million total on its 520 employees at BARC (excluding employees at BARC’s National Agriculture Library or Carver office complex). If you assume that 2.6% of that total was spent on buildings and facilities, then that works out to $7,231 annually per employee. This total does not include the cost of lab-equipment maintenance or replacement when it becomes out of date.
[29] This $9,200–$14,800 rough estimate for the cost to rent space for an agricultural researcher was calculated by multiplying an annual rental rate of $23–$38 per square foot by an assumed 400 ft2 per researcher. There is some evidence that an agricultural researcher typically needs more space than an ordinary desk worker because many researchers need some combination of desk space, laboratories, greenhouses, and space to support fieldwork. Program administrators and desk workers (not researchers specifically) were allocated 294 ft2 each when BARC’s George Washington Carver office complex was recently renovated. That figure is the implied allowance per employee when you take the four buildings’ 350,000 ft2 area and divide by the number of employees that the buildings are intended to accommodate, i.e., 1,911 employees: USDA, 2020, GWCC Modernization Beltsville, Maryland, Solicitation No. 12314420B0001, page 8.
[30] The higher estimate, $82,000 per year per researcher, is calculated from 360 ft2/researcher times $23/ft2 to rent ordinary office space times 10 to reflect the fact that lab space is more expensive per square foot than ordinary office space. Lab space may cost five or ten times as much per square foot as ordinary office space according to the Site Selection and University Lab Partners websites, respectively. A rule of thumb for how much office and lab space is needed for researchers is 1200–1500 ft2 for a seven-member team made up of a principal investigator and six other team members. This rule is sometimes written as PI+6=1200 NASF and PI+6=1500 NASF (Washington University in St. Louis). The “NASF” unit stands for net-assignable square feet. NASF is expressed in square feet and is always less than the building’s gross floor space. According to the Young Architect website and others, ordinary office buildings can assign 75% to 90% of their gross square feet to employees, but for laboratories, much less can be assigned (50%–65%), which essentially means that a larger building is required to get the same amount of useable space if the intended purpose is laboratory research. Combining these factors results in an estimate of 360 gross ft2 needed per researcher, calculated as 1500 useable ft2 per team divided by 0.60 useable ft2 per gross ft2 and dividing by 7 members per team.
The lower estimate, $24,000 per year per researcher, is calculated from $14,500 per month for a team of seven multiplied by 12 months in the year and divided by 7 members in the team. For example, Valley Research Park, offers 1,000–2,738 rentable square feet for $8,900–$14,500/month, which is about room for a seven-member research team. That range works out to an annual cost of about $15,000–$24,000 per researcher. In contrast, the annual rental cost would be more ($48,000 per researcher per year) at the $4,000 per month per researcher rate offered by LabCentral in Kendall Square.
[31] Currently, the USDA public, online, employee directory lists only 114 people working at the Carver office complex on the BARC campus, although it can accommodate 1,911 employees. Then again, there may be more than 114 people assigned to the Carver office complex. The reason to be suspicious of the online employee directory is that it lists zero people working for ARS at BARC. From a budget document, we know that, in FY 2024, 520 ARS employees worked at BARC, not counting another 73 ARS employees who work at the National Agriculture Library on BARC’s campus.
When trying to figure out how many people work at BARC, part of the mystery is that an ARS webpage states that the ARS headquarters is in the Whitten Building in DC, but also that the ARS headquarters staff all work in the Carver office complex on the BARC campus, i.e., on Sunnyside Avenue in Beltsville, Maryland. An ARS budget document for FY 2024 stated that ARS had 499 employees in “headquarters, federal administration” and that this function was located in the District of Columbia. It is possible that most of these headquarters employees that the budget document listed as working in the District of Columbia are actually working in Maryland in BARC’s Carver office complex. If so, that would increase the total number ARS employees at BARC in FY 2024 to about 1,191. To wit, 1,191 is the sum of 599 ARS headquarter employees, 520 regular ARS BARC employees (excluding the library), and 72 ARS employees at the BARC library.
Appendix D shows that, during the past 25 years, 906,000 ft2 of building floor space has been renovated at BARC. If you assigned 400 ft2 to each employee, then that much space could accommodate more than two thousand workers, which is most likely more than are working at BARC currently. Publicly available information may be incomplete, which could lead to this rough estimate being inaccurate.
[32] At the July 30, 2025, Senate hearing, Deputy Secretary Vaden expressed concern about “vastly empty government buildings that dot the District of Columbia” (1:52:10).
[33] Secretary Rollins has made other similar statements. In her July 24, 2025, pre-recorded video address to USDA employees, the Secretary said that the goal was to “better serve the American people and to return to our core mission of servicing American farmers, ranchers, foresters, and producers.” At July 30, 2025 senate hearing, Deputy Secretary Vaden said that the USDA reorganization would move employees “closer to the American people that we serve” (30:40).
[34] The value of the East Coast’s annual agricultural product can be calculated by summing the values for 17 states and District of Columbia. The value for each state can be found in the USDA’s 2022 agricultural survey.
[35] President Trump, June 7, 2017; Jones Day, March 2019; and Council of Foreign Relations, September 2023.


Jeremy
Thank you for the comprehensive and professional report
Kathie Jarva
Excellent report Owen. Thank you.